
As most people expected, the UK recorded music industry returned to growth in 2015. The UK now follows an increasingly familiar European narrative of strong streaming growth helping bring total markets back to growth. Sales revenue increased 3.5% to reach £1.1 billion while total streams increased by 85% to reach 53.7 billion, with audio stream representing 49.9% of that total. There is no doubt that these are welcome figures for the UK music industry but as is always the case, a little digging beneath the surface of the numbers reveals a more complex and nuanced story. Here are the three things you need to know about UK music sales in 2015.
1 – Streaming Growth Accompanied A Download Collapse
Long term readers will know that I’ve long argued the ‘Replacement Theory’, that streaming growth directly reduces download sales. It is a simple and inevitable artefact of the transition process. Indeed a quarter of subscribers state they used to but no longer buy more than one album a month since they started paying for streaming. There have been plenty of opponents to this argument, normally from parties with vested interests. But the market data is now becoming unequivocal. While streams increased by 257% between 2013 and 2015 download sales decreased by 23%. And of course the vast majority of that streaming volume came from free streams, not paid.

2 – The Transition Follows A Clear Defined Path
The download to streaming transition is an inevitability, whatever business models are wrapped around it. It is part of the fundamental shift from ownership to access of which streaming music is but single component. It comprises consumers progressively replacing one behaviour with another. In fact, the evolution is so deliberate and predictable that it manifests in a clear numerical relationship: the Transition Triangle.
The UK music industry trade body the BPI has created a number of additional classifications for music sales and consumption. These include Stream Equivalent Albums (1,000 streams = 1 album) and Track Equivalent Sales (10 track sales = 1 album). Using these classifications and adding in actual album download sales we see a very clear relationship between the growth of streaming and the decline of downloads. The difference in volumes between downloads and streams each year is almost exactly the same as the amount by which downloads decreased the previous year. At this point even the most ardent replacement theory sceptic might start suspecting there’s at least some degree of causality at play.

3 – Thanks Are Due To Adele, Again
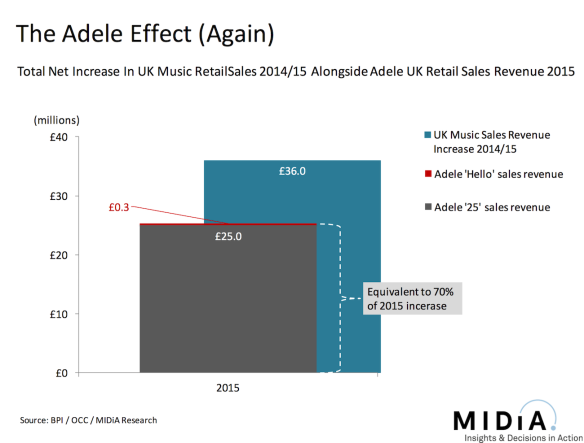
Back when Adele’s ‘21’ was setting sales records, music markets across the globe owed her a debt of gratitude for helping slow the incessant decline in sales. Global revenue decline fell to less than 1% and US revenue actually grew by 2.9% (falling back down the following year). Now she’s done it again with ’25’, giving album sales enough of a boost to ensure that the growth in streaming revenue lifted the entire market. For although album sales actually declined in 2015 and streaming volumes had grown more strongly in 2014, it was the combined impact of slowed album decline and streaming growth in 2015 that enabled the total market to grow so strongly.
Adele generated around £25 million of retail sales revenue in 2015, which was equivalent to 70% of the £36 million by which UK music sales revenue increased that year. While of course a portion of that £25 million would have been spent on other repertoire if ‘25’ had not been released, the majority would not. With ‘21’ and now with ‘25’ Adele has been able to pull casual music consumers out of the woodwork and persuade them to buy one of the only albums they’ll buy all year, often the only one.
Without that £25 million UK music sales would have increased by just 1%. So in effect streaming services have Adele to thank for ensuring their growth lifted the whole market even though she famously held ‘25’ back from each and every one of them. Sweet irony indeed.
As a final postscript, the role of YouTube, while underplayed in the official figures, is crucial. While audio streams grew by an impressive 81% in 2015, video streams grew by 88%. So however good a job the streaming services might be doing of growing their market, YouTube is doing an even better one.

Full steam stampede to STREAMING wonderland! UMG induced all inclusive subscription streaming is an industrywide suicide leading to $20B dwarf land.
Convert streaming and Radio to advertising and subscription free, discovery moment monetization, $100B music store.
We can have $200B music industry before 2025 at just 39 cents per addition to the playlist!
Stream numbers and Radio play numbers are in TRILLIONS per month and should be harnessed to simple music monetization machine.
I’m not a ‘replacement theory sceptic’, but I’m struggling to make sense of your figures and diagrams. You say that ‘ The difference in volumes between downloads and streams each year is almost exactly the same as the amount by which downloads decreased the previous year.’
OK, let’s work that out for 2014 and 2015 (all figures in millions):
2014: album equivalent downloads: 45
album equivalent streams: 147
difference: 147-45 = 102
decrease in downloads 2013-14: 51-45 = 6
2015: album equivalent downloads: 39
album equivalent streams: 268
difference: 268-39 = 229
decrease in downloads 2014-15: 45-39 = 6
So not only is the ‘difference in volumes between downloads and streams each year’ very definitely *not* exactly the same as the decrease in downloads, but the decrease in downloads was constant whereas the increase in streaming was significantly greater in the second period than in the first. Maybe there is some definite relationship lurking in the figures, but I don’t see what it is.
By the way, without Adele, the industry would have shrank again!
Reblogged this on The Logistics of Being a Music Business Graduate.
David – you misread the graphic. It doesn’t say decrease in downloads, it says increase in streams. The amount by which streams increase each year is as big as the gap between streams and downloads that year.
Well, that isn’t what you said in your article, in the passage which I copied and pasted into my comment. And it doesn’t seem to be true anyway.* As they say on the maths exam papers, ‘please show your workings’!
*e.g. for 2015 the increase in streams since 2014 is 120m, which is roughly equal to a ‘difference’ of 122m shown in your diagram, but you don’t say where you get that ‘difference’. It is not the ‘difference’ between streams and downloads in 2015, which in the same diagram is 268-39 = 229.
I’m sorry, I didn’t get this sentence:
Sales revenue increased 3.5% to reach £1.1 billion while total streams increased by 85% to reach 53.7 billion,…
53.7 billion of what? If it’s number of streams, what is the revenue those streams created?
Thank you in advance!
Whilst discussions pertaining to arithmetic calculations provide mild amusement, may I respectfully remind all correspondents that the vast majority of audio streams are consumed for FREE.
Reblogged this on Music2Deal.
Pingback: Sales Analysis – 2015 | Music for stowaways